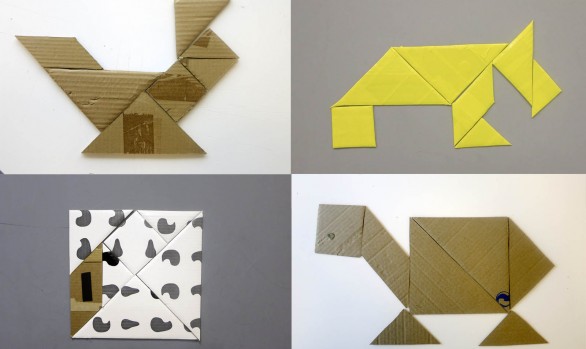
Dissecting Objects
Research / WorkshopAnalyzing and visualizing how much waste we buy everyday. Co-organized with Dietmar Offenhuber in the Guggenheim Lab at Berlin.
How much waste do we buy?
We’ve been asking ourselves the same question since many years ago. We’ve been thinking different ways how to show the world the absurdity of buying and wasting so much material. From the objects in Basurmantes exhibition Nacidos para morir (Born to die, 2004) to the video Chainwork (2008), to mention some, we’ve been trying possible ways.
This time we wanted to add some numbers to the equation. We didn’t want ‘numbers’ extracted from data bases generated by governments and recycling companies. We just wanted to know how much waste we buy. We’ve figured out a simple equation:
Waste Packaging Index (WPI) = Packaging / Total Weight of the product
Products with no packaging, like a tomato, would have a 0% WPI, and merchandising products that are onlye packaging would be 100% WPI.
Workshop, hands on!
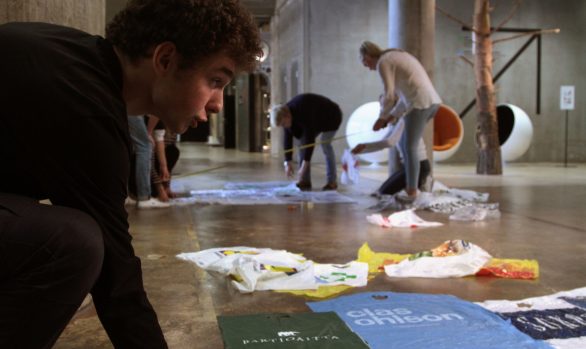
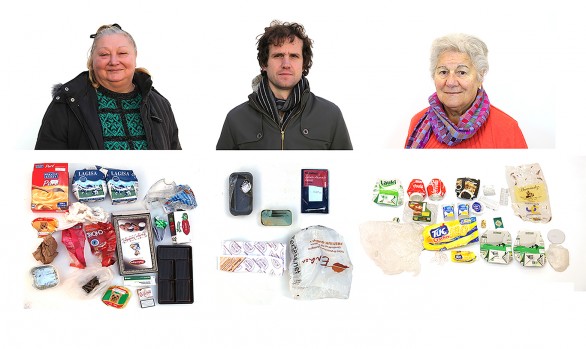
We started with a small amount of products in our first “Dissect Waste” workshop. We went to the supermarket and bought different articles: what a joy to know that we are buying waste! Our purpose was to weigh the products and their packaging to make a straight forward visualizations of the data obtained.
Data were collected and shared publicly, so that everyone can use or add more information to them. We decided to use only available online tools, no need of programming skills: a simple spreadsheet at gdocs.
Weighing and labeling all the products took us a long time: we were ‘forced’ to eat and drink milk, beer, cookies an juice in order to not spoil the items purchased! Once we were finished we could arrange the products in order related to the Waste Packaging Index. With the help of a projector we were displaying on the table the bar chart with the different data from the WPI.
This was just the first visualization that we’ve planned to do with the participants. We wanted a question to arise naturally, and it happened: “Is it enough to measure the weight? Depending on the type of material some products are more harmless than others. How to compare the tetrapack (aluminium, plastic and cardboard put together) with a cardboard coated box? Is weight the only measure?”
Actimel, a kind of yougurt sold in very small plastic bottles, was among the objects with less WPI. Some participants in the workshop suggested that it should be taken out the visualization, to not mislead suggesting that Actimel was a “good” with not much packaging product. We know that this product had plastic, cardboard and aluminium. We prefered to let it be and comment the flaws of the systems. One visualization, one data set, one equation, one index is always limited but it is still a powerful tool.
We knew we needed to go deeper, and that is what we want to research. We had prepared a series of other WPI that took in account things like:
- the volume of the materials (both compresed and uncompresed)
- the price of the materials, both up and downstreaming (materials as raw products or the price you get when recycling)
- the footprint of the materials (we were thinking on using footprinted API)
- materials depending on where are they going to end theirs lives (recycling, reuse, burnt, disposed in a land fill)
Anyway, we still love the Waste Packaging Index: it’s simple to measure and you don’t rely on other third party data to calculate it. It’s true that it has its limitations, but it still helps understand the quantity of waste we buy.
At the right of our bar chart were the raw materials: an apple, at the left light products with a lot of packaging, like the tea bags. We are so used to them that we do not realize that tea bags,tea lables, tea strings and tead boxes are not needed: we just need some good tea leaves to enjoy a good tea!
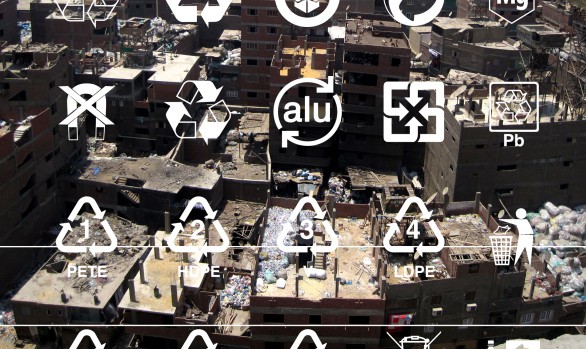
Both the workshop and the Waste Packagin Index are good ways to explain the importance of creating and sharing our own data sets. We live surrounded by data, in the information age, but we still need to generate our own data sets to measure what we need. We can not only rely on data provided by recycling companies (in Berlin those data tell that 100% of the plastic is recycled, obviously controversial if the only plastic that it’s being measured is the one that arrives to the recycling plant).
That’s why initiatives regarding #opendata, like the collective efforts of the Public Laboratory to realease available aerial photography information or a specrophotomereal data base, are so important to give citizens the information they need.
We are now planning future workshops and creating a digital tool to gather data to make Waste Pacakging Index available for everyone. We are also planning how to represent it. We encourage you to try, all you need is a scale, products and time to upload your data!
Related info
The presentation we used in the workshop.
List to data resources on Life Cycle Analysis and waste management: http://bit.ly/lcawastedata
Related posts: Weighing a scale
You can find about the workshop on Dietmar’s website or at Guggenheimlab one.