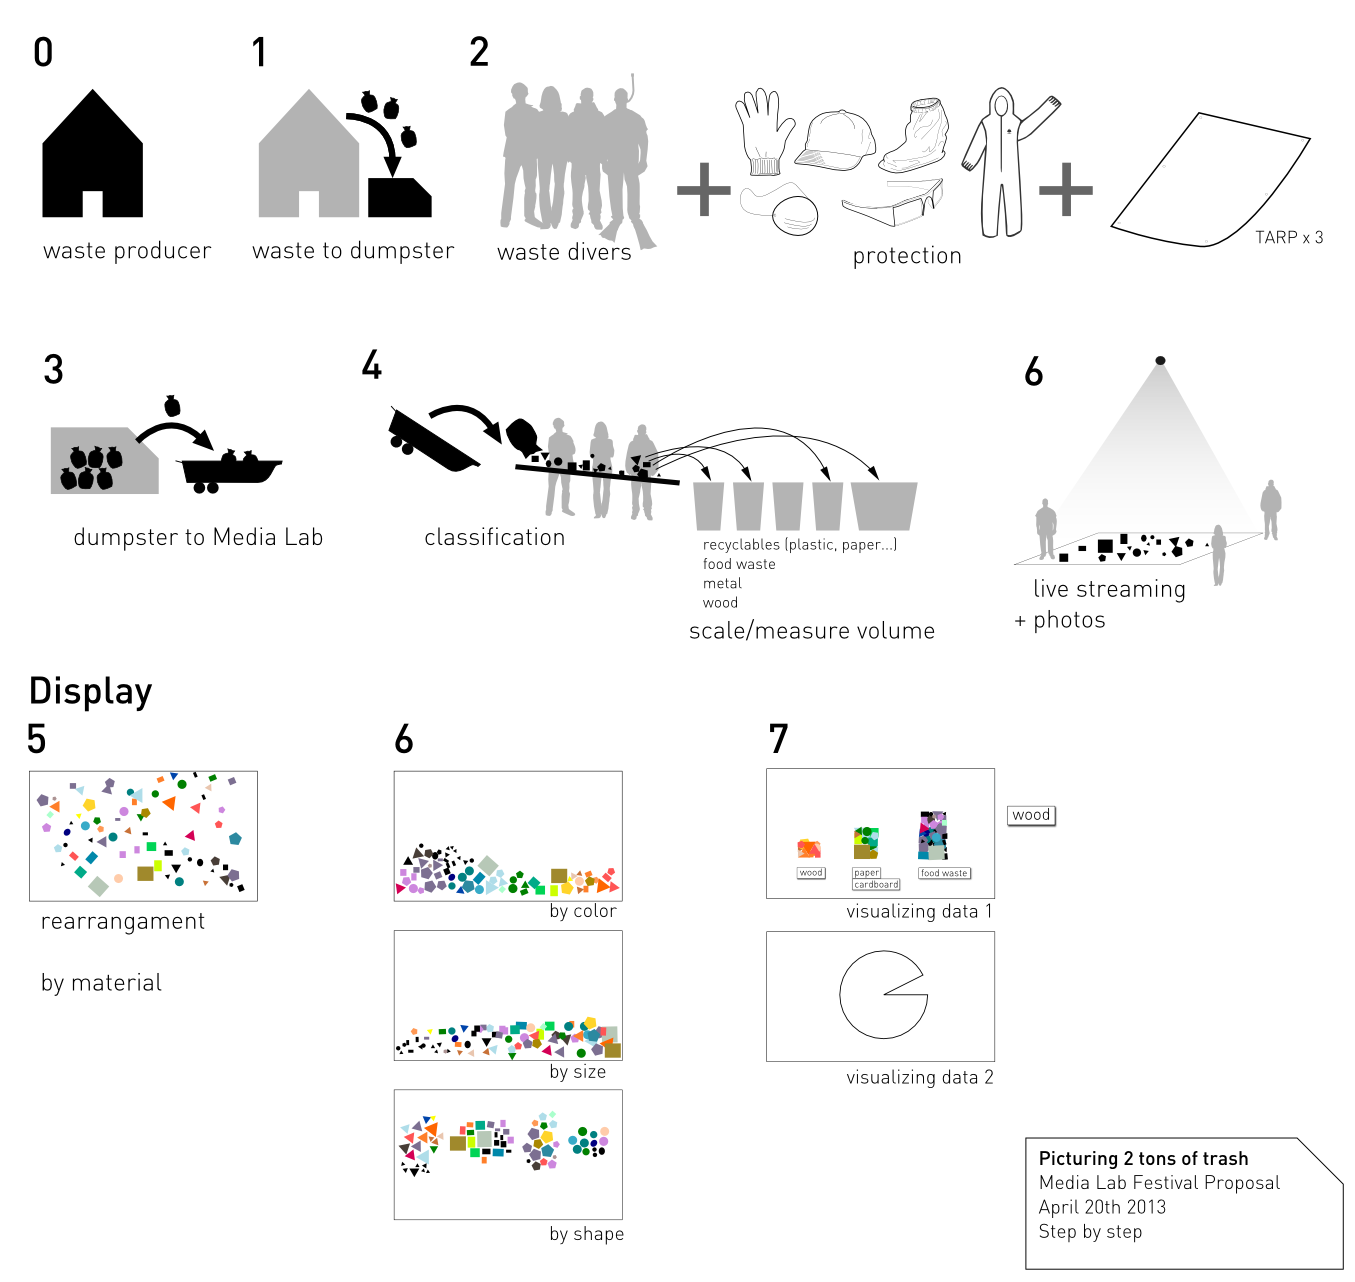
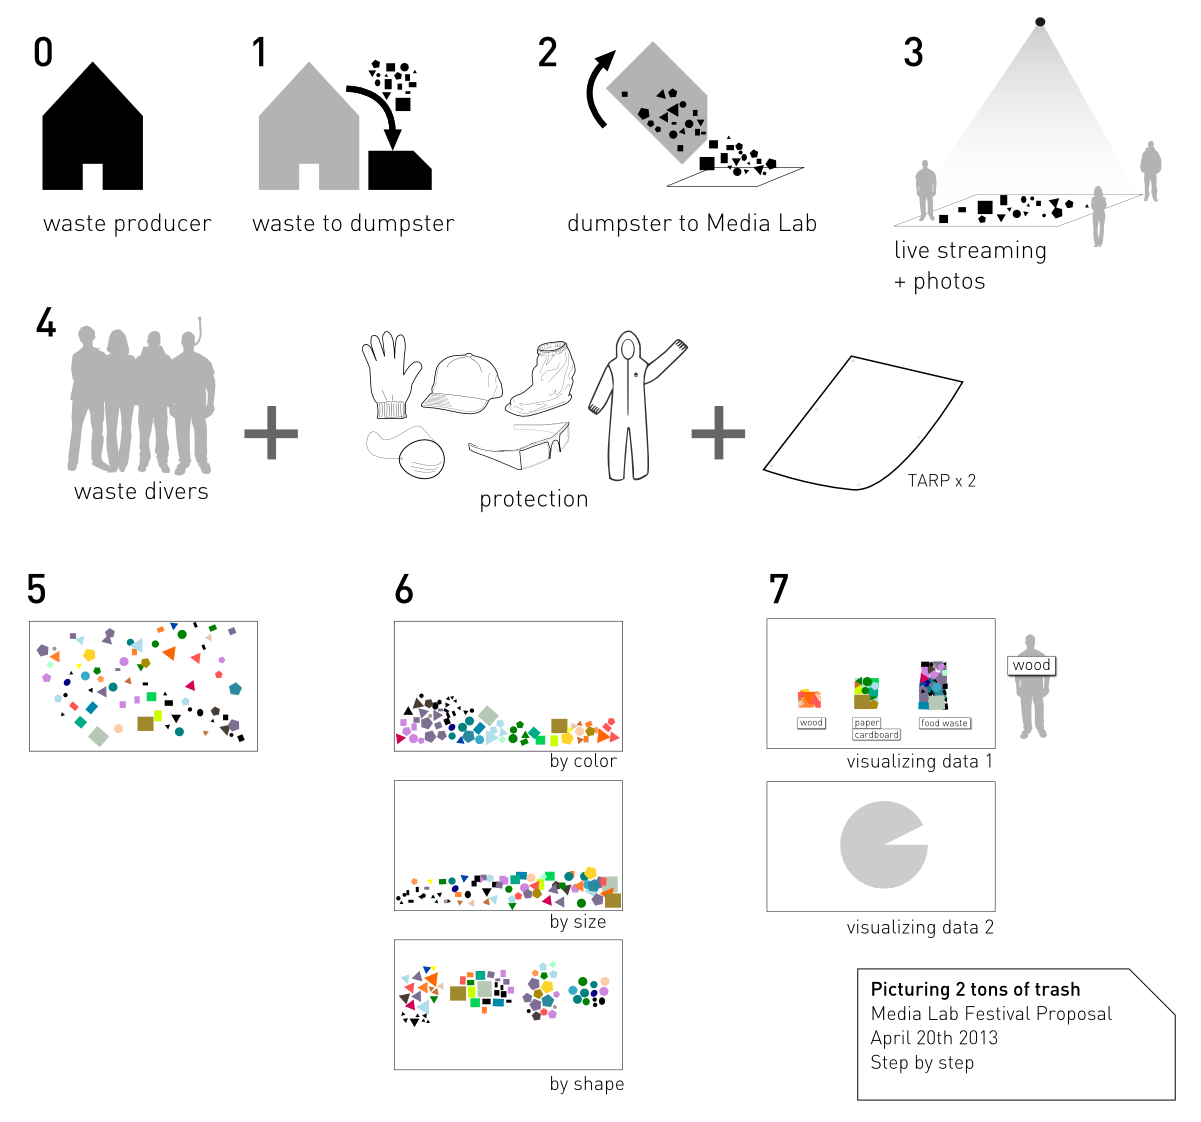
Step by step guide to picture 2 tons of waste
The MIT Media Lab “The Other Festival” and this activity were cancelled because of the Boston Marathon bombings.
More info and participants web page.
Updated April 8th 2013
We are working on the logistics for the Picturing 2 tons of waste installation. I’ve made an initial draft of how we want to proceed with the rearrangement of waste. The first approach is to classify waste by material (recyclables, food waste, wood, metal, etc). Then to organize waste by color and then use that separation to construct different data visualization. It’s yet unclear if we are going to be able to weight it, maybe measure volume and estimate weight? The data visualizations can be based on the numbers extracted from previous MIT or Cambridge audits.
Any feedback?
If you plan to attend the event to sort waste with us send an email to: boston [at] basurama.org
Note: drawing made using the clip art gallery from inkscape . You can search for objects from the menu: File > Import from Open Clip Gallery.
See previous version of this step by step guide
2 Comments »
Comments RSS feed for this post. TrackBack URL
[…] developed the graphic above to think through how they might display the waste after the audit. I’ve posted elsewhere […]
Pingback by How to picture two tons of waste? Trashy theaters of proof. | Discard Studies — 04/15/2013 @ 8:13
[…] MIT Police Officer that was shot to death last Friday, some of the projects could be installed (my trash visualization project could not be done). So I was able to install the PageOneX real size with stories related […]
Pingback by numeroteca » Guns, Wars and Terrorism in a PageOneX real size — 04/25/2013 @ 2:48