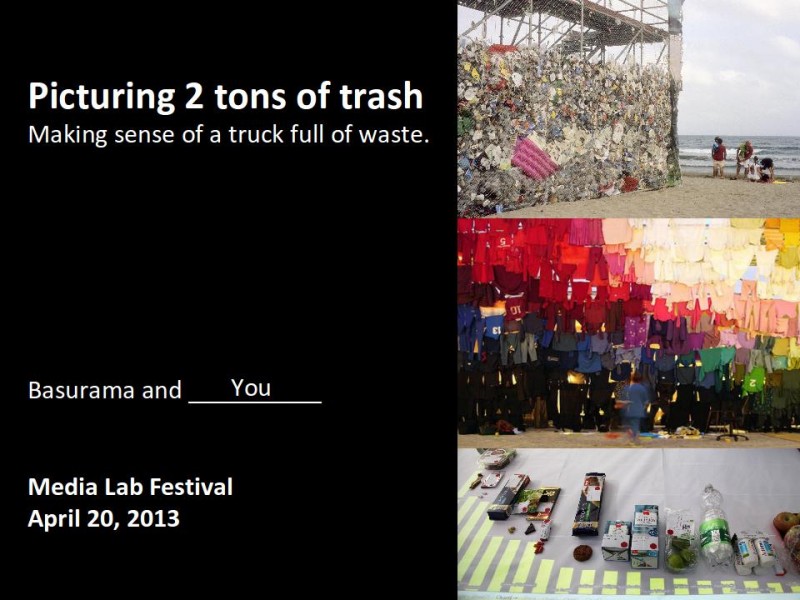
How to picture 2 tons of waste?
Once in a while, the Recycling Department of the Cambridge Department of Public Works organizes a volunteer sorting of waste. A city truck collects a sampling of trash of residential buildings from a specific neighborhood. Trash gets sorted into different categories (cardboard, fibers, commingled, rigid plastics) and other trash to calculate the amount of waste that is not being recycled. The outcome of the process is the data, but what if we make this process public and invite people to ‘jump’ into waste? Can we make the process visually fun and compelling without compromising privacy issues?
The performance-installation consist of the reordering of 2 tons of waste. When we rearrange waste, we no longer see a ‘grey’ mix: we understand that waste is made of things, things that were objects once, that are objects now, objects that are made of materials. During the day, waste will be rearranged by type of material, color or shape forming a series of data visualizations related to waste and recycling in Cambridge.
We want to decode trash and make it pretty and understandable. Our aim is to use trash as the construction material and also as the subject of our data visualization installation. Therefore, we’ll use trash to build graphics about trash itself!
When? Whole day. April 20th 2013
Where? Outside the MIT Media Lab, during the Media Lab Festival.
Write boston [at] basurama.org if you want to join: sorting and rearranging waste, thinking together which visualizations we could make…
1 Comment »
Comments RSS feed for this post. TrackBack URL

[…] for the end of the month, April 20th, I am preparing a waste installation How to picture 2 tons of waste? for April 20th. It’s going to be fun and… I need your help! Category: basura […]
Pingback by numeroteca » April full of trash activities — 04/02/2013 @ 20:42